Envis Centre, Ministry of Environment & Forest, Govt. of India
Printed Date: Monday, January 12, 2026
Coal & Lignite 2016-17
Graphical Representation
.jpg)
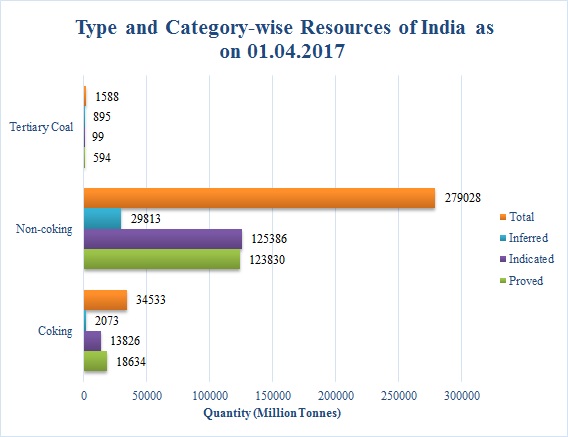
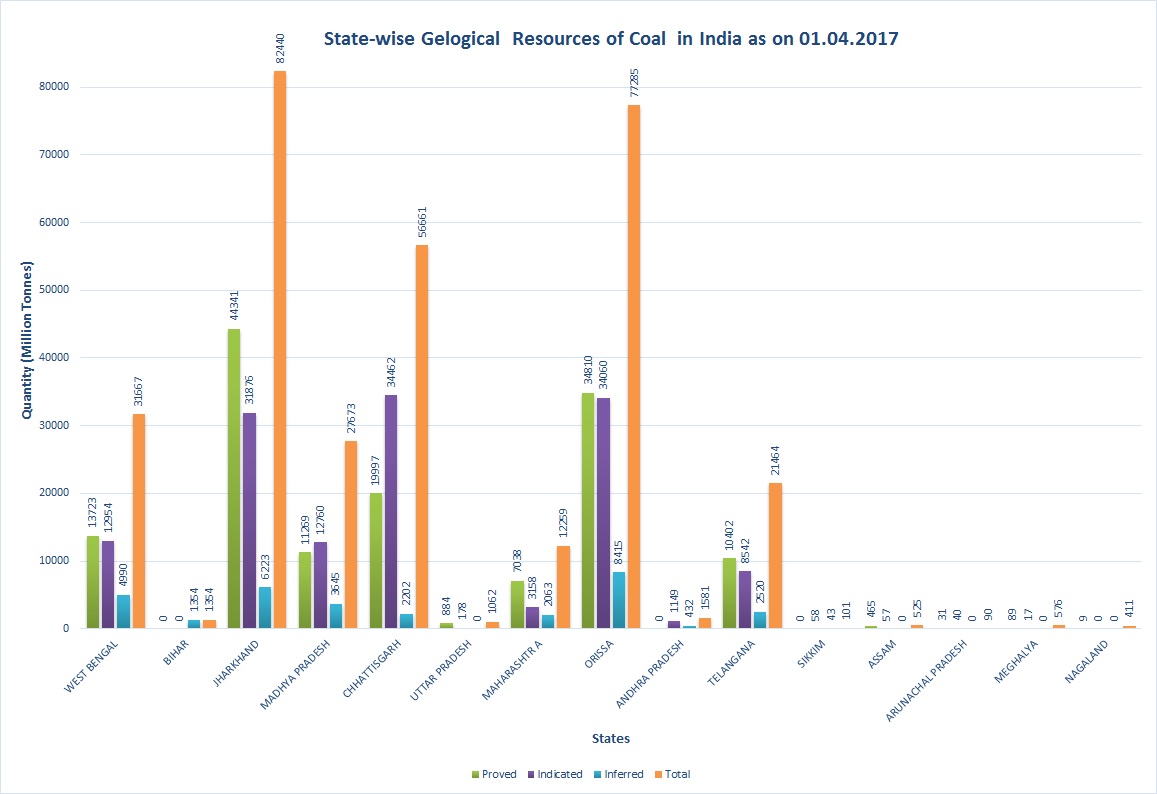
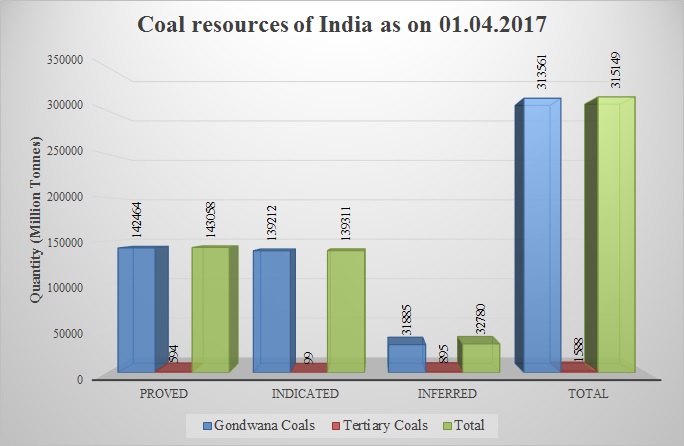
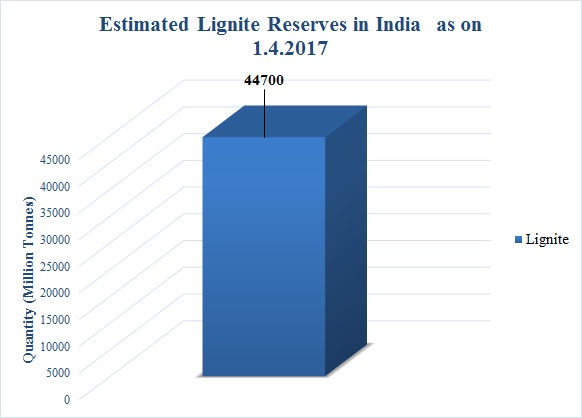
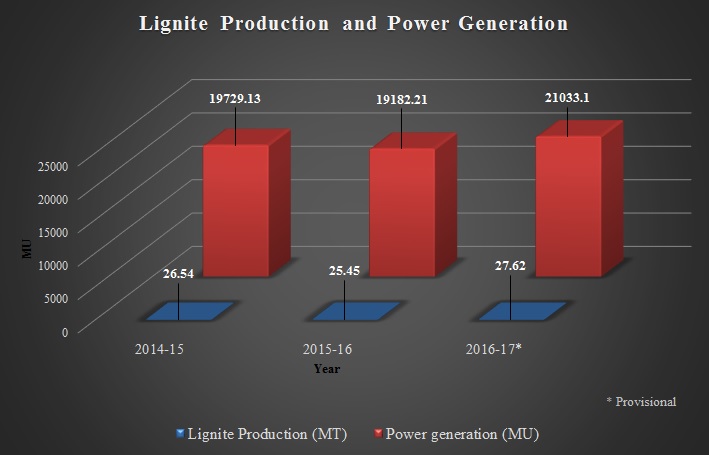
.jpg)
.jpg)
%20.jpg)
.jpg)
.jpg)
Tabular Values
Company wise Raw Coal Dispatch:
|
Company
|
Apr’17- Dec’17
|
Apr’16-Dec’16
|
%
growth
|
|
Target
|
Actual
|
% achievement
|
Actual
|
|
CIL
|
431.93
|
421.22
|
98
|
391.58
|
7.6
|
|
SCCL
|
62.00
|
41.99
|
67.72
|
61.34
|
-1.01
|
Sector wise Raw Coal Dispatch (Provisional):
(In Million tonnes)
|
Sector
|
Apr’17-Dec’17
|
Apr’16-Dec’16
|
% growth in Apr’17-Dec’17 over Apr’16-Dec’16
|
|
Steel *
|
4.11
|
4.84
|
-15.0%
|
|
Power ( Utility )**
|
331.44
|
308.24
|
7.5%
|
|
Power( Captive) ***
|
29.02
|
22.47
|
29.2%
|
|
Cement
|
2.95
|
2.64
|
11.9%
|
|
Others
|
53.69
|
53.39
|
0.6%
|
|
CIL #
|
421.22
|
391.58
|
7.6%
|
* includes coking coal feed to washeries, direct feed and blendable to steel plants
** includes non-coking coal feed to washery and Bina Deshaling Plant for beneficiation and special forward e-auction to power
*** Captive Power includes despatches to fertilizer sector
# excludes colliery consumption
Sector wise Raw coal Dispatch (Jan-Mar’18 projection on BE basis):
(In Million tonnes)
|
Sector
|
Jan’18-Mar’18
|
Jan’17-Mar’17
|
% growth in Jan’18-Mar’18 over Jan’17-Mar’17
|
|
Steel *
|
2.00
|
1.92
|
4.2
|
|
Power ( Utility )**
|
128.95
|
118.05
|
9.2
|
|
Power( Captive)#
|
14.09
|
8.38
|
68.1
|
|
Cement
|
1.98
|
1.04
|
90.7
|
|
Others
|
31.52
|
22.09
|
42.7
|
|
CIL
|
178.54
|
151.47
|
17.9
|
* includes coking coal feed to washeries, direct feed and blendable to steel plants,
** includes non-coking coal feed to washery and Bina Deshaling Plant for beneficiation and special forward e-auction to power
# Captive Power includes dispatches to fertilizer sector
Sector wise Dispatch- SCCL:
(In Million tonnes)
|
Sector
|
April – December 2017
|
April – December 2016
|
Growth (%)
|
January –March 17 (Anticipated)
|
2017-18
(Anticipated)
|
|
Power (utility)
|
38.89
|
36.46
|
6.68
|
14.99
|
53.88
|
|
Power (CPP)
|
2.03
|
1.25
|
61.95
|
0.75
|
2.78
|
|
Steel (SI)
|
0.160
|
0.06
|
183.93
|
0.15
|
0.31
|
|
Cement
|
1.87
|
1.48
|
26.15
|
0.70
|
2.57
|
|
Others
|
3.91
|
3.45
|
13.44
|
1.54
|
5.46
|
|
Total : SCCL
|
46.86
|
42.70
|
9.75
|
18.14
|
65.00
|
Supply of Coal in 2017-18 :
(Fig. in Million Tonne)
|
Sl. No.
|
Sector
|
2012-13
Actual
|
2013-14
Actual
|
2014-15
Actual
|
2015-16
Actual
|
2016-17
Actual (Prov.)
|
2017-18
Estimated Demand
|
2017-18
Actual
April-Dec. (P)
|
|
I.
|
Coking Coal
|
|
|
|
|
|
1
|
Steel / Coke Oven Cokeries (Indigenous)
|
&
|
15.50
|
15.49
|
12.02
|
12.27
|
12.50
|
-
|
10.66
|
|
2
|
Steel (Import)
|
35.56
|
36.87
|
43.72
|
44.56
|
41.64
|
-
|
26.95
|
|
|
Sub Total
|
51.06
|
52.36
|
55.74
|
56.83
|
54.14
|
63.17
|
37.61
|
|
II.
|
Non Coking Coal
|
|
|
|
|
|
3
|
Power (Utilities)
|
387.77
|
394.53
|
435.44
|
483.12
|
496.57
|
622.96
|
384.88
|
|
4
|
Power (Captive)
|
59.00
|
54.42
|
62.26
|
34.65
|
30.68
|
90.34
|
23.865
|
|
5
|
Cement
|
22.38
|
21.02
|
11.36
|
8.99
|
6.43
|
22.32
|
5.017
|
|
6
|
Sponge Iron/ CDI
|
20.90
|
18.49
|
17.77
|
7.76
|
5.68
|
24.61
|
4.27
|
|
7
|
BRK & Others .including Fertilizer
|
172.27
|
198.52
|
239.57
|
245.37
|
248.05
|
85.00
|
165.62
|
|
|
Sub Total
|
662.33
|
686.98
|
766.39
|
779.89
|
787.41
|
845.23
|
583.65
|
|
|
Total Raw Coal
|
713.39
|
739.34
|
822.13
|
836.73
|
841.56
|
908.40
|
621.26
|
|
|
P=Provisional,
|
|
|
Source :Coal Controller Organisation
|
|
|