You are here :
Home Coal and Lignite Production (2021-22)
|
Last Updated:: 10/04/2023
Coal and Lignite Production (2021-22)
Coal Demand:
(in MT)
| |
Sector
|
2016-17 Actual
|
2017-18 Actual
|
2018-19 Actual
|
2019-20 Actual
|
2020-21 (Actual) Provisional
|
2021-22
(upto Nov 2021) (Provisional)
|
|
I.
|
Coking Coal
|
|
|
|
|
|
|
|
1
|
Steel / Coke Oven & Cookeries (Indigenous)
|
10.336
|
11.447
|
17.662
|
11.908
|
8.975
|
6.747
|
|
2
|
Steel (Import)
|
41.644
|
47.003
|
51.838
|
51.833
|
51.198
|
34.250
|
|
|
Total (Coking Coal)
|
51.980
|
58.450
|
69.500
|
63.741
|
60.173
|
40.996
|
|
II.
|
Non Coking Coal
|
|
|
|
|
|
|
|
3
|
Power (Utilities)
|
490.987
|
519.582
|
546.170
|
540.995
|
535.447
|
402.502
|
|
4
|
Power (Captive)
|
44.057
|
65.906
|
91.779
|
85.154
|
45.786
|
34.418
|
|
5
|
Cement
|
6.356
|
7.708
|
8.817
|
8.569
|
6.754
|
5.077
|
|
6
|
Sponge Iron
|
5.557
|
8.528
|
12.231
|
10.529
|
9.565
|
7.190
|
|
7
|
BRK & Others Including Fertilizer
|
88.685
|
76.832
|
56.135
|
50.021
|
84.357
|
63.412
|
|
|
Total
(Non Coking Coal)
|
591.250
|
635.642
|
678.556
|
715.132
|
695.268
|
681.909
|
|
8
|
Non-Coking Coal (Import)
|
149.309
|
161.269
|
183.402
|
196.704
|
164.053
|
96.796
|
|
III.
|
Total Supply (I + II)
|
836.931
|
898.276
|
968.034
|
955.713
|
906.135
|
650.391
|
Note:
1. Figure of 2020-21 is Provisional.
2. Import Figure Upto Oct, 2021.
3. Actual Supply of 2021-22 (upto Nov 21 using previous year’s ratio.)
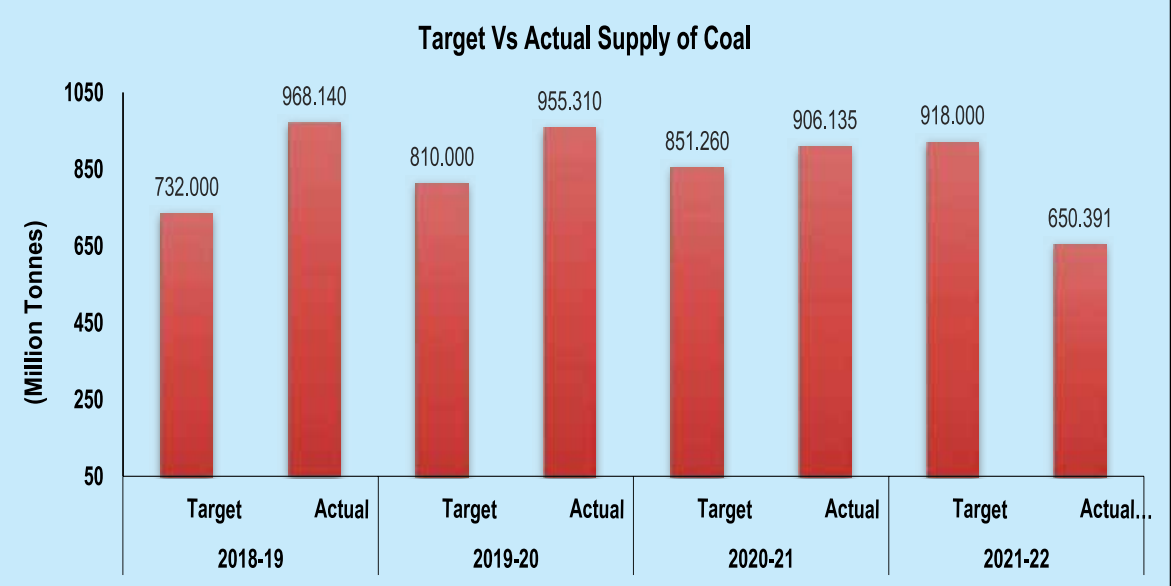
Coal Supply:
|
Source
|
2018-19 Target
|
2018-19 Actual
|
2019-20 Target
|
2019-20 (Provisional)
|
2020-21 Target
|
2020-21 (Provisional)
|
2021-22 Target (Estimated)
|
2021-22 (upto Nov,21) (Provisional)
|
|
CIL
|
610.00
|
607.953
|
660.00
|
581.640
|
660.000
|
573.628
|
740.000
|
421.230
|
|
SCCL
|
67.00
|
67.669
|
67.00
|
62.465
|
67.500
|
48.513
|
68.000
|
42.475
|
|
Captive
|
40.00
|
49.623
|
66.20
|
56.257
|
85.830
|
62.624
|
99.000
|
52.592
|
|
Others
|
15.00
|
7.549
|
16.80
|
6.814
|
15.430
|
6.119
|
11.000
|
3.123
|
|
Total Indigenous Supply
|
732.00
|
732.794
|
810.00
|
707.176 8
|
828.760
|
690.884
|
918.000
|
519.420
|
|
Import
|
|
235.35
|
|
248.54
|
|
215.251
|
|
131.045
|
|
Demand Projected/ Actual Supply (Domestic + Import)
|
732.00
|
968.14
|
810.00
|
955.31
|
828.760
|
906.135
|
918.000
|
650.391
|
Note:
1.* Import figure is upto Oct-2021.
2. CIL data includes GP IV/I and GP IV/2 & 3 (Custodian SECL).
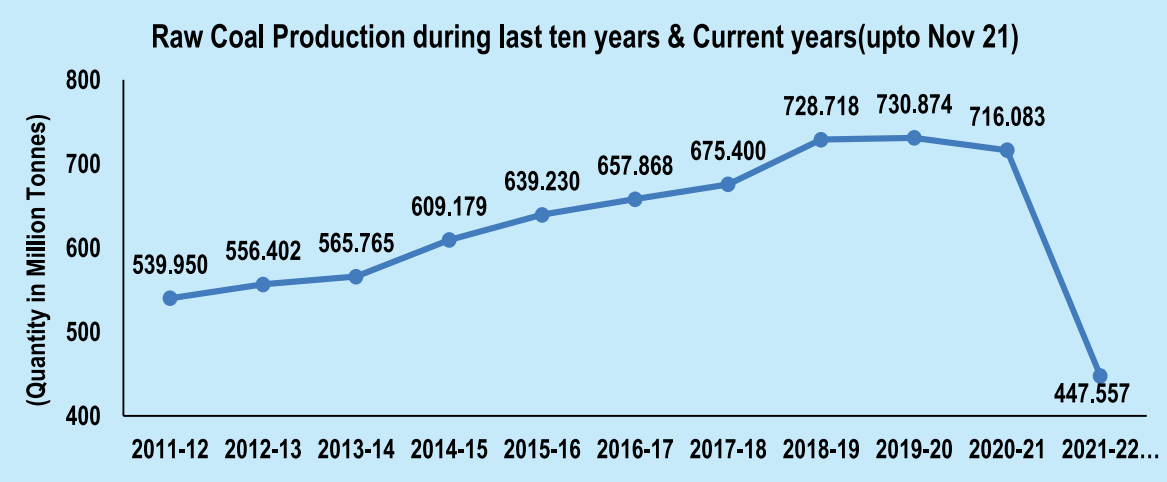
Coal Production:
(In MT)
|
Company
|
2018-19 (Actual)
|
2019-20 (Target)
|
2019-20 (Actual)
|
2020-21 (Target)
|
2020-21 (Actual)
|
2021-22 (Target)
|
2021-22 (upto Nov,21) (Provisional)
|
Achievement %
|
|
ECL
|
50.16
|
53.500
|
50.401
|
52.000
|
45.004
|
52.000
|
18.350
|
35.29
|
|
BCCL
|
31.039
|
36.000
|
27.729
|
29.000
|
24.656
|
30.000
|
17.220
|
57.40
|
|
CCL
|
68.721
|
77.000
|
66.889
|
74.000
|
62.589
|
74.000
|
36.370
|
49.15
|
|
NCL
|
101.503
|
106.250
|
108.053
|
113.000
|
115.042
|
119.000
|
75.120
|
63.13
|
|
WCL
|
53.18
|
56.000
|
57.636
|
60.000
|
50.275
|
60.000
|
28.370
|
47.28
|
|
SECL*
|
157.349
|
170.500
|
150.546
|
172.000
|
150.606
|
172.000
|
77.849
|
45.26
|
|
MCL
|
144.151
|
160.000
|
140.358
|
160.000
|
148.013
|
163.000
|
100.141
|
61.44
|
|
NEC
|
0.784
|
0.750
|
0.517
|
0.000
|
0.036
|
0.000
|
0.000
|
0.00
|
|
CIL
|
606.887
|
660.000
|
602.129
|
660.000
|
596.221
|
670.000
|
353.420
|
52.75
|
|
SCCL
|
64.401
|
67.000
|
64.044
|
67.500
|
50.580
|
68.000
|
40.865
|
60.08
|
|
Captive
|
49.900
|
66.200
|
57.875
|
85.830
|
63.149
|
99.000
|
50.216
|
50.72
|
|
Others
|
7.530
|
16.800
|
6.826
|
15.430
|
6.133
|
11.000
|
3.055
|
27.85
|
|
TOTAL
|
728.718
|
810.000
|
730.874
|
828.760
|
716.083
|
848.000
|
447.557
|
52.78%
|
* Production of Gare Palma-IV/1 and Gare Palma-IV/ 2 & 3 of SECL is added to CIL and not included in Captive
Lignite and Power Production
|
Year
|
Lignite (MTe)
|
Power Generation (NLCIL) (in MU)
|
|
Lignite and Power Production
|
24.50
|
20,676.18
|
|
2019-20 (Actual)
|
24.86
|
21,922.98
|
|
2020-21 (Actual)
|
19.26
|
19,322.00
|
|
2020-21 (Jan 21 to Mar 21)
|
6.75
|
5,579.26
|
|
BE 2021-22
|
24.65
|
24,305.39
|
|
2021-22 (uptoNov 21) (Provl)
|
14.84
|
16,432.86
|
Production of Captive Lignite Company during the last Five Years and Current Year (upto Nov'2021)
(in MT)
|
Company
|
2016-17
|
2017-18
|
2018-19
|
2019-20
|
2020-21
|
2021-22
(upto Nov'21) (Prov.)
|
|
GMDCL
|
7.652
|
10.601
|
9.160
|
6.957
|
6.004
|
5.224
|
|
GIPCL
|
2.816
|
3.123
|
3.313
|
3.342
|
3.507
|
1.291
|
|
RSMML
|
0.549
|
1.019
|
1.317
|
0.790
|
0.830
|
1.324
|
|
GHCL
|
0.078
|
0.057
|
0.093
|
0.058
|
0.021
|
0.048
|
|
VSLPPL
|
0.508
|
0.426
|
0.305
|
0.672
|
0.971
|
0.665
|
|
BLMCL
|
6.010
|
6.265
|
5.845
|
5.413
|
6.018
|
3.792
|
|
GPCL
|
|
|
|
|
1.281
|
0.995
|
|
All India
|
17.613
|
21.491
|
20.033
|
17.232
|
18.632
|
13.339
|
Output per Manshift - (Actual)
|
Year
|
Coal India Ltd.
|
Singareni Collieries Co. Ltd.
|
|
UG
|
OC
|
Overall
|
UG
|
OC
|
Overall
|
|
2015-16
|
0.80
|
15.35
|
7.15
|
1.25
|
13.78
|
4.20
|
|
2016-17
|
0.80
|
15.00
|
7.48
|
1.18
|
13.85
|
4.74
|
|
2017-18
|
0.86
|
13.15
|
7.44
|
1.08
|
13.73
|
4.89
|
|
2018-19
|
0.95
|
15.21
|
8.67
|
1.39
|
16.95
|
6.22
|
|
2019-20
|
0.99
|
17.90
|
9.64
|
1.44
|
16.57
|
4.89
|
|
2020-21
|
0.93
|
19.42
|
10.32
|
0.92
|
13.86
|
5.62
|
|
2021-22
(upto Nov 2021)
|
0.94
|
14.61
|
8.64
|
1.11
|
14.41
|
5.72
|
Capital Outlay:
(i) Coal India Limited (CIL):
( ₹ in Crores)
|
Name of PSU
|
2020-21
|
2021-22
|
2022-23
|
|
BE
|
RE
|
Actual
|
BE
|
RE
|
Exp.
(Upto Nov. 2021)
|
BE
|
|
CIL
|
10000.00
|
13000.00
|
13283.83
|
14685.00
|
14685.00
|
7721.10
|
16500.00
|
(ii) NLC India Limited (NLCIL):
( ₹ in Crores)
|
Scheme
|
2018-19
|
2019-20
|
2020-21
|
Jan’21 to Mar’21
|
2021-22
|
2021-22
|
2021-22 (Upto Nov’ 21) (Provisional)
|
2022-23
|
|
Actual
|
Actual
|
Actual
|
BE
|
RE
|
BE
|
|
NLCIL Total
|
7208.16
|
6469.62
|
2881.04
|
860.06
|
2750.00
|
2750.00
|
1637.23
|
2920.22
|
(iii) The Singareni Collieries Company Limited (SCCL):
( ₹ in Crores)
|
Name of PSU
|
2015-16
|
2016-17
|
2017-18
|
2018-19
|
2019-20
|
2020-21
|
2021-22
|
|
Actual
|
Actual
|
Actual
|
Actual
|
Actual
|
Actual
|
BE
|
RE
|
Actual (up to Nov, 2021)
|
|
SCCL
|
2820.22
|
2013.55
|
1477.39
|
1229.69
|
2257.60
|
1310.08
|
2500.00
|
2000.00
|
1101.92
|
Plan Expenditure
|
Year
|
Capital Expenditure of SCCL (₹ Crs.)
|
|
2014-15 (BE)
2014-15 (RE)
2014-15 (Actual)
|
3850.00
3760.00
2809.00
|
|
2015-16 (BE)
2015-16 (RE)
2015-16 (Actual)
|
2390.00
3550.00
2820.22
|
|
2016-17 (BE)
2016-17 (RE)
2016-17 (Actual)
|
2300.00
2300.00
2013.55
|
|
2017-18 (BE)
2017-18 (RE)
2017-18 (Provl.)
|
1600.00
1400.00
1477.39
|
|
2018-19 (BE)
2018-19 (RE)
2018-19 (Actual)
|
2000.00
1100.00
1229.69
|
|
2019-20 (BE)
2019-20 (RE)
2019-20 (Actual)
|
1850.00
1850.00
2257.60
|
|
2020-21 (BE)
2020-21 (RE)
2020-21 (Actual)
2021-22 (BE)
2021-22 (RE)
2021-22 (Actual)
|
2300.00
1750.00
1310.08
2500.00
2000.00
1101.92
|
(Source:Ministry Of Coal, Annual Report 2021-22)